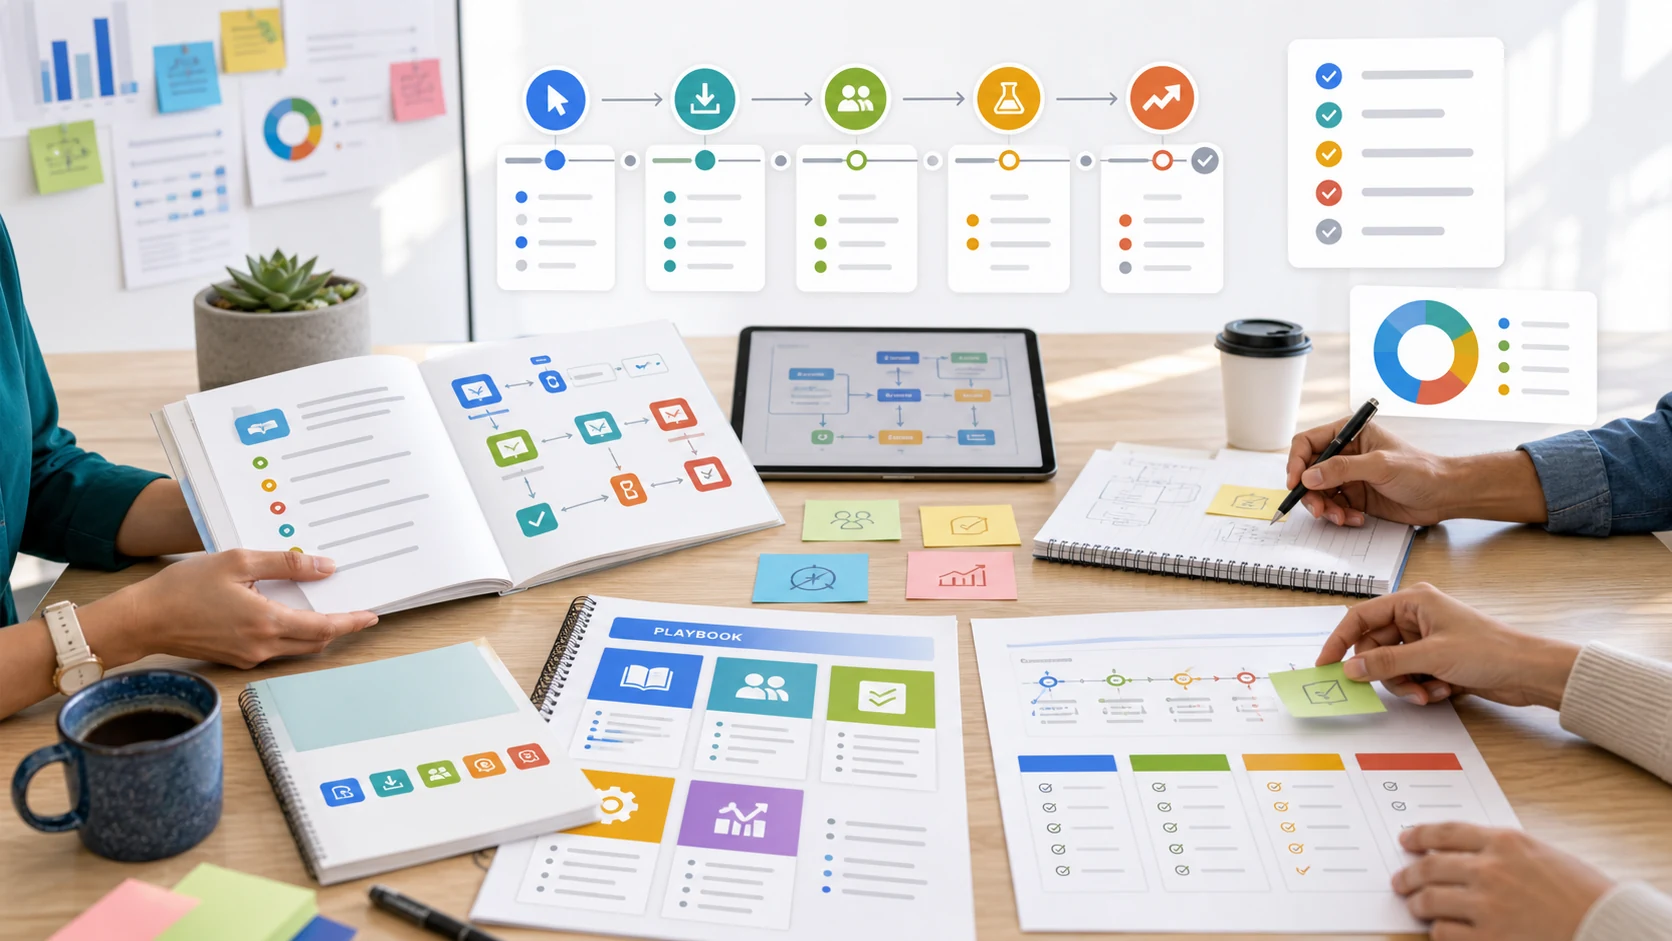
1Start with structure
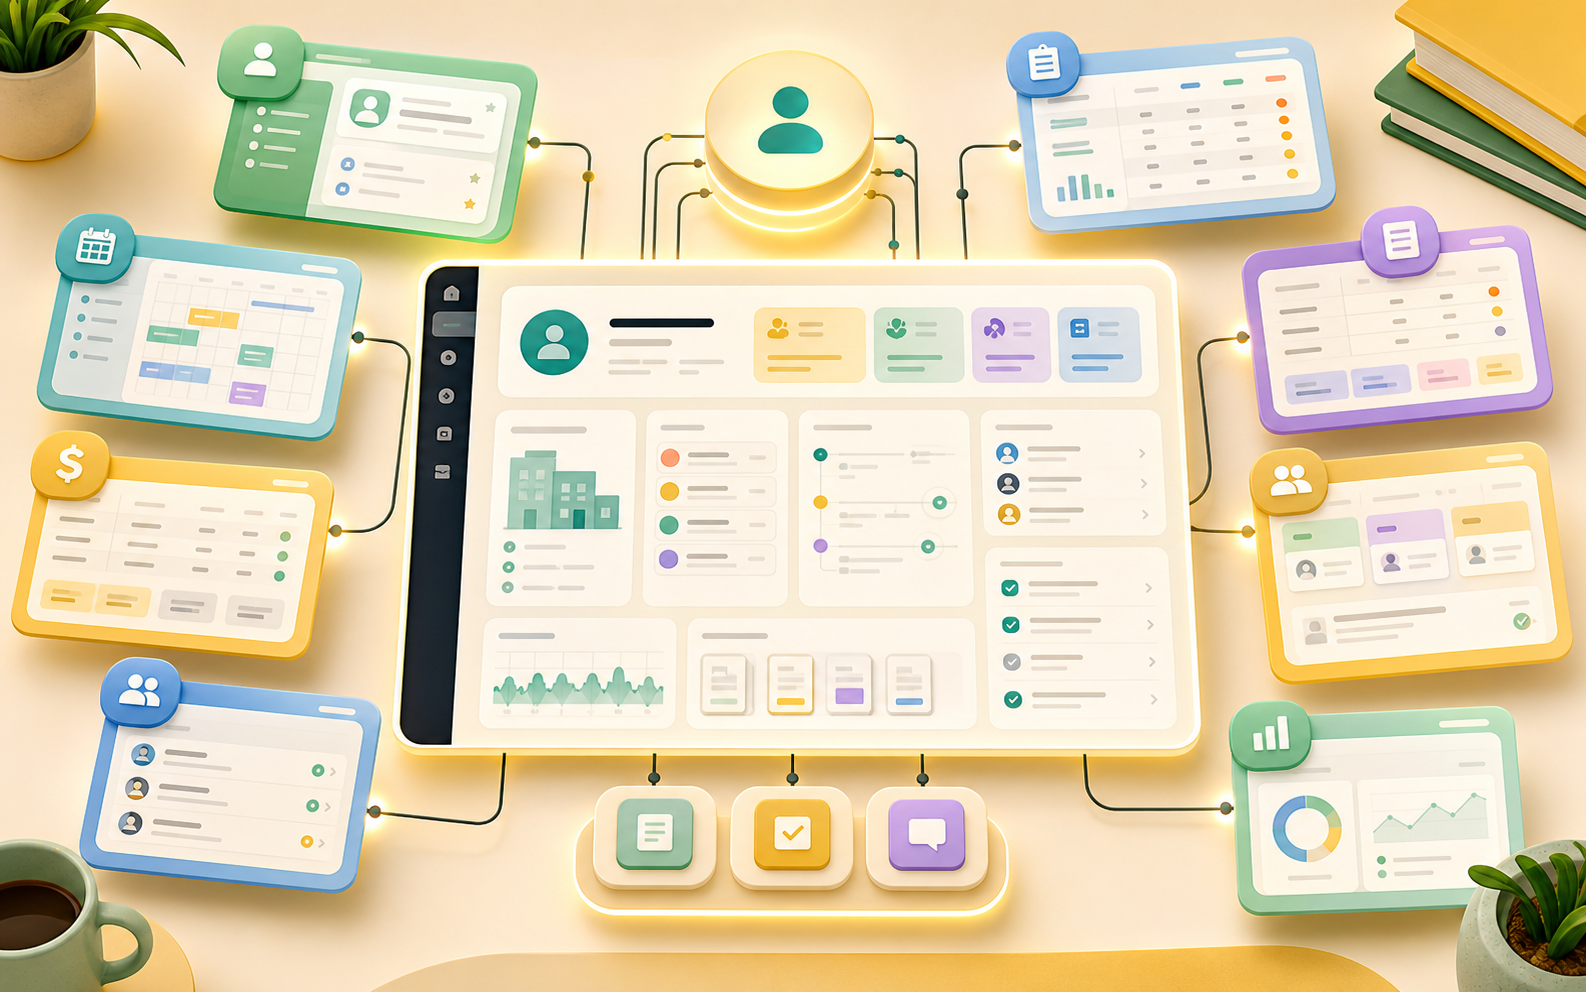
Operational dashboards
Monitor task completion, overdue work, relationship health, revenue, and workflow reliability.
Feature
Create operational dashboards from saved views across tasks, relationships, workflows, revenue, apps, and teams.
What this page gives you
Reports should tell a buyer what they can actually run in Taskingos: the records they need, the handoffs the team owns, and the reports that show what needs attention.
Example workflow
Start reports with the record, request, customer, or task context the team needs before work moves.
Use this stage to collect context, update status, and keep reports moving through the workspace.
Use this stage to collect context, update status, and keep reports moving through the workspace.
Use this stage to collect context, update status, and keep reports moving through the workspace.
Close the loop with owner accountability, saved views, and reporting so the next action is visible.
 Operational dashboards
Monitor task completion, overdue work, relationship health, revenue, and workflow reliability.
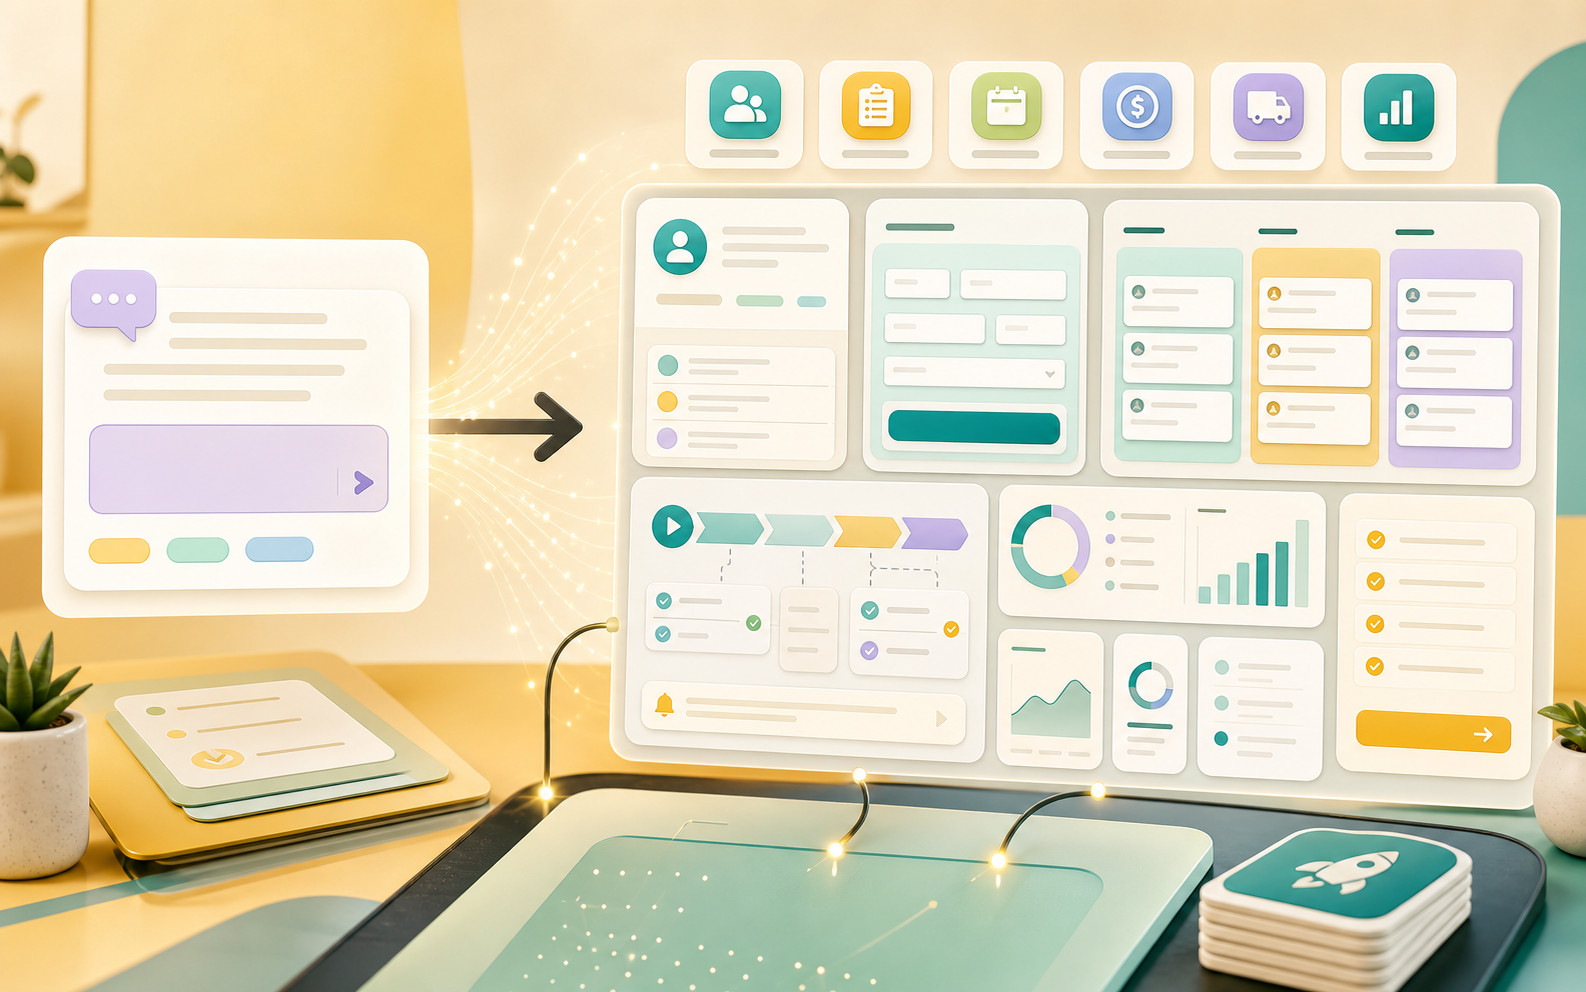
 Reusable saved views
The same saved view can power grids, dashboard widgets, exports, and workflow conditions.
Reports should become visible through concrete records, task ownership, stage movement, and operating reports.
Reports should become visible through concrete records, task ownership, stage movement, and operating reports.
Reports should become visible through concrete records, task ownership, stage movement, and operating reports.
Reports should become visible through concrete records, task ownership, stage movement, and operating reports.
Create operational dashboards from saved views across tasks, relationships, workflows, revenue, apps, and teams.
Reports connects the workflow to shared records, owners, tasks, and reports instead of creating a separate place for the team to check.
Yes. Start with choose source, then adapt fields, stages, owners, saved views, and reports such as saved reports.
Start from a proven pattern, then tailor the records, tasks, automations, and reporting to how your team works.